Through their construction and operation, buildings are responsible for 28% of global carbon emissions. How do you track whether your buildings are being operated efficiently, and are you making best use of the space you already have?
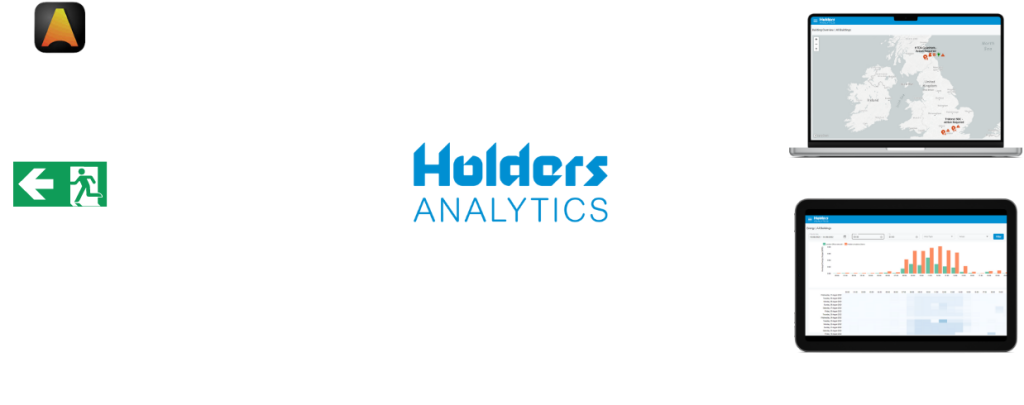
Holders Analytics allows you to measure energy consumption, space utilisation, lighting levels and reports any network faults.
With data sent directly to your device, building estate information can accessed securely from anywhere in the world.
The dashboard presents data visually through graphic representations with the help of its intuitive user interface.
How it works
bUILDING DATA MADE ACCESSIBLE
A single dashboard
Track the performance of your entire emergency lighting estate through your browser
Granular data
Drill down in to specific sites to see the detail of any of your buildings or floors.
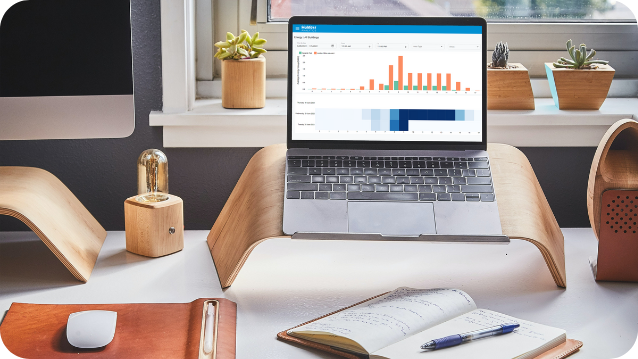
Improved energy efficiency
Track and analyse energy consumption to lower energy bills and your carbon footprint
Simplify estate management
Configurable, real-time notifications of device status and test results
Secure & flexible data extraction
From a simple email to full API data integration – securely connect data from multiple third-party vendors